Page 150 - TBIS_15194-2019_(EN)_3nd
P. 150
TBIS 15194:2019
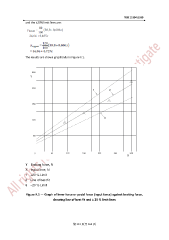
and the ±20% limit lines are:
The results are shown graphically in Figure F.1.
Y Braking force, N
X Input force, N
1 +20 % Limit
2 Line of best fit
3 −20 % Limit
Figure F.1 — Graph of lever force or pedal force (input force) against braking force,
showing line of best fit and ± 20 % limit lines
第 142 頁共 162 頁